


ExchangeRight REIT Increases Credit Facility, More Than Tripling Lender Commitments
The committed capacity for the Essential Income REIT’s revolving line of credit has increased from …
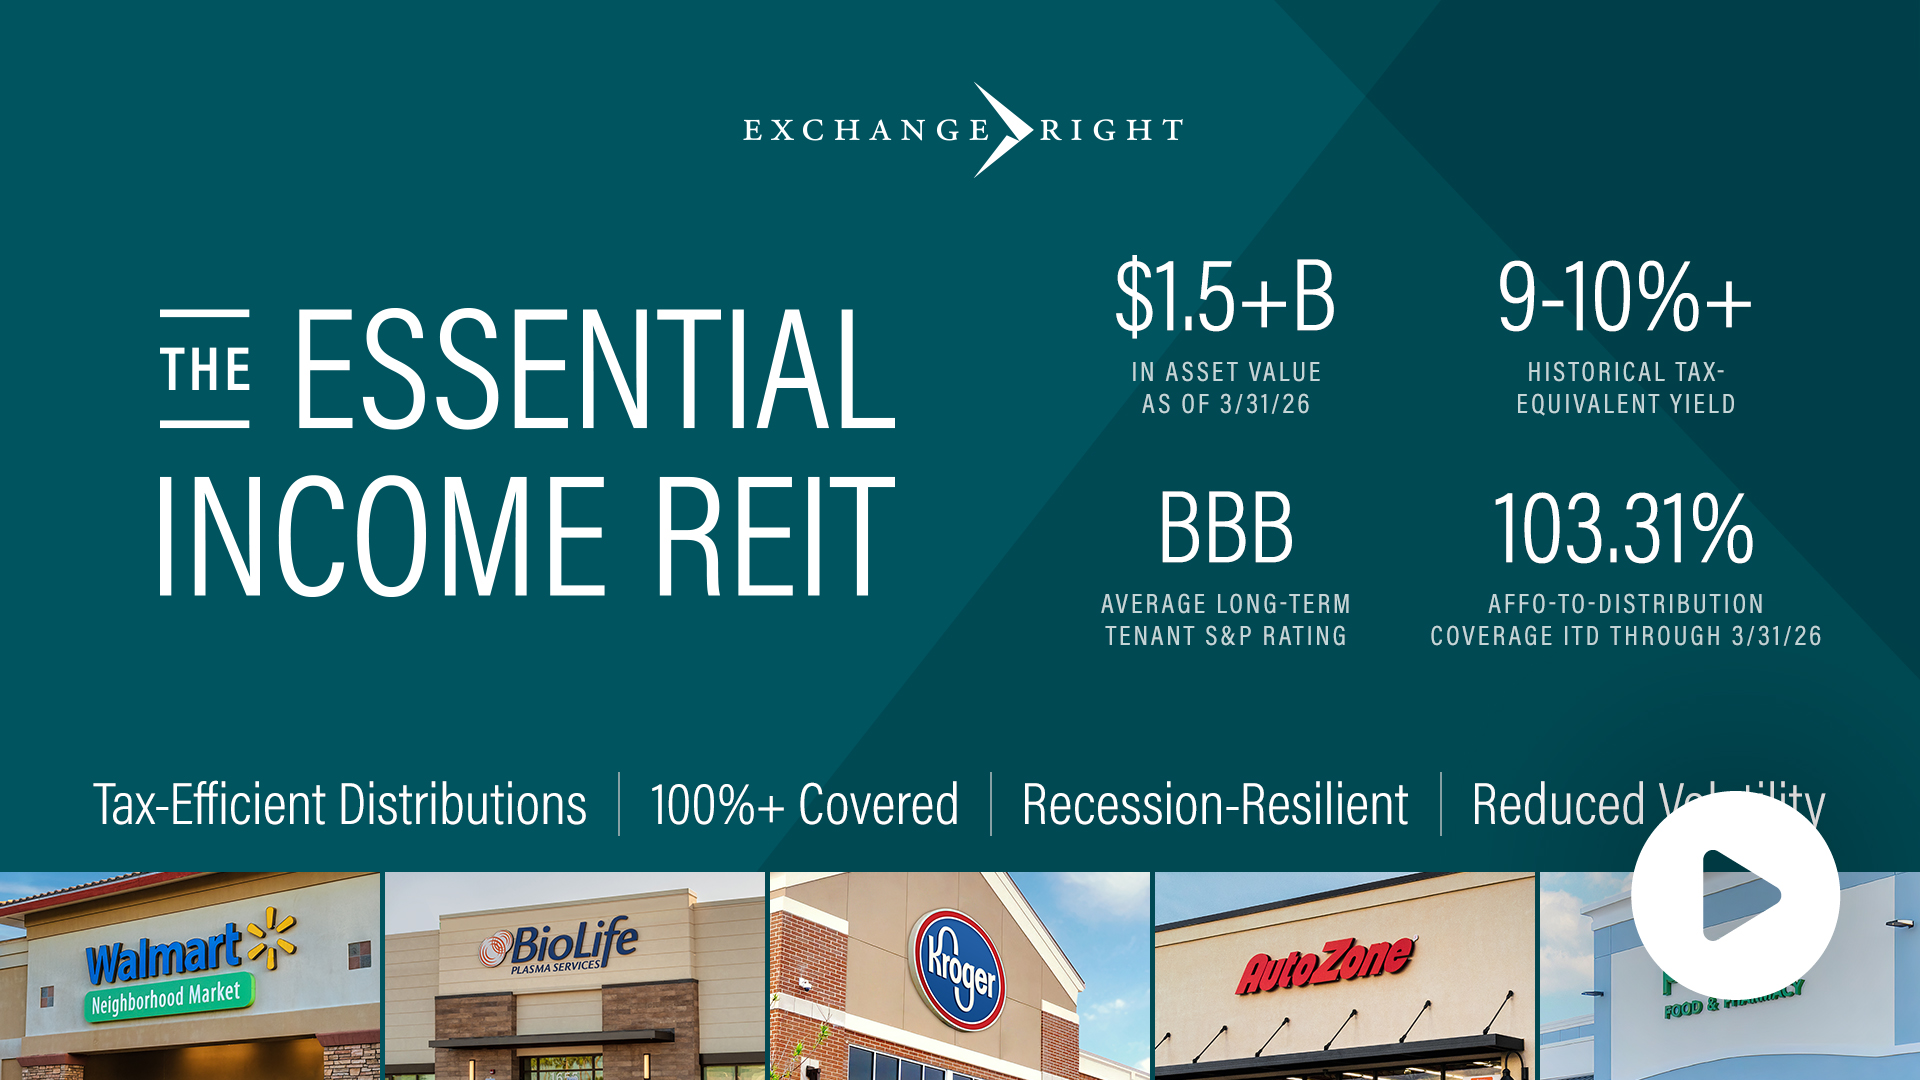
Continue ReadingThe Essential Income REIT has delivered consistent tax-efficient distributions (over 69% tax-deferred in 2025) fully covered by cash flow from operations, generating compelling total returns with reduced volatility to investors since inception.


1Class D and S historical returns are hypothetical based on the actual returns that would have been achieved if those share classes had been outstanding during the periods presented.
2ITD stands for "Inception-to-Date".
3The tax-equivalent yield range presented above for Class I, D, S, and A shares is based on the 2025 results, current offering price, a 37% federal income tax rate, an 8% state income tax rate, and a 3.8% Medicare surcharge tax. Exact tax-equivalent yield will vary by investor.
4The average long-term S&P credit rating is presented as a simple average of the credit ratings of the REIT’s tenants with publicly rated debt.
5AFFO stands for “Adjusted Funds from Operations”.
There is no guarantee that the Essential Income REIT will be successful in executing its business plan. Pictures are representative of similar corporate-backed stores in the ExchangeRight portfolio and are not actual properties included in the portfolio. Unless otherwise noted, all stats are as of 3/31/26.
The Essential Income REIT has paid monthly distributions that have been tax-efficient and fully covered by cash flow from operations with reduced volatility since inception.


The REIT features a quarterly redemption program for Class I, D, S, and A shares to provide liquidity and has fulfilled 100% of all redemption requests since inception.3
1The tax-equivalent yield graph above provides a historical illustration of the potential tax benefits based on the current NAV/share, a 37% federal income tax rate, an 8% state income tax rate, and a 3.8% Medicare surcharge tax. Each investor should consult with their own tax advisor. Exact tax-equivalent yield will vary by investor and may be lower for certain share classes.
2AFFO stands for “Adjusted Funds from Operations.”
3Distribution coverage stats are based on Blue Vault’s 2024 Non-traded REIT Industry Review (4th ed.) pp. 51-102, which calculates AFFO, modified funds from operations (MFFO), or core funds from operations (FFO) divided by distributions declared for all growth or stabilizing equity non-traded REITs.
Returns are not guaranteed and past performance is not a guarantee of future results. There is no guarantee that the Essential Income REIT will be successful in executing its business plan.
Our passion to empower investors to be secure, free, and generous shapes everything we do and has resulted in a REIT that is distinct in approach, structure, and performance.
We are wealth managers who built this REIT to meet the tax-efficient income and growth needs of our own long-term clients.
We invest alongside investors and employ a below-market fee structure to increase investor returns and align interests.
We start with a macroeconomic framework to preserve investor capital and provide stable income throughout economic cycles.
We conduct rigorous due diligence to acquire only the top net-leased properties that meet our stringent criteria.
We generate consistent tax-efficient income that has been 100%+ covered by cash flow from operations since inception.
The information above is as of 3/31/26. The due diligence conducted does not guarantee investment performance. There is no guarantee that any offering will achieve its investment objectives including exit or aggregation strategies. Past performance does not guarantee future results.
Corporate Overview
3/31/26
Blue Vault Report (Q3 2025)
9/30/25
Why Investment-Grade Tenants?
6/10/25
DRIP Plan
3/18/26
ExchangeRight REIT Increases Credit Facility, More Than Tripling Lender Commitments
The committed capacity for the Essential Income REIT’s revolving line of credit has increased from …
Continue ReadingThe Essential Income REIT Achieves 10.42% Tax-Equivalent Yield on 2025 Distributions
The Essential Income REIT’s tax-equivalent yield on 2025 distributions was 10.42%, assuming an investment was …
Continue ReadingEssential Income REIT’s Net Asset Value Per Share Increases in Q4 2025
The Net Asset Value (“NAV”) per share of the Essential Income REIT has increased to …
Continue Reading

Warren has over 40 years of experience as a CPA and has been an active commercial real estate investor for the past 30 years. Prior to focusing on the securitized 1031 exchange market in 2003, he developed an extensive tax practice including estate planning, financial planning, and real estate advisory services. He graduated in 1978 from Biola University with a B.S. in Business, specializing in Accounting. He also earned a master’s degree in Taxation from Golden Gate University in 1993. He maintains Series 6, 7, 22, 24, 39, 63, 66, and 79 Securities Licenses.

Joshua currently serves as Managing Partner of ExchangeRight and Telos Capital, and continues to serve as CEO and Chief Investment Officer of a wealth management firm and Broker-Dealer specializing in securitized real estate investments. Together with his Partners, Joshua has overseen and underwritten the acquisition of over $6 billion in real estate. Joshua graduated from The Master’s College, summa cum laude with a B.A. in Theology, Apologetics, and Missions and is currently on leave from Talbot Graduate School, where he was pursuing an M.A. in Philosophy of Religion and Ethics. He also maintains Series 7, 22, 24, 63, 66, and 79 securities licenses and an active California real estate broker license.

David is primarily responsible for the acquisition, asset management, financing, and advocacy efforts related to ExchangeRight and its affiliate businesses. He is an active member of the Federation of Exchange Accommodators, Institute for Portfolio Alternatives, and the Tax Committee of the Real Estate Round Table, where he focuses on lobbying efforts in Congress to protect the interests of investors and other stakeholders in the health and stability of the American commercial real estate market.
David began his real estate and finance career nearly three decades ago as a manager in the tax department of KPMG. He later joined Wells Fargo, where he focused on tax, treasury, and acquisitions for more than seven years. From 2005 until 2012, he served as HSBC’s North American Head of Asset and Structured Finance for the company’s investment banking division, where he and his banking teams executed international financings in excess of $8 billion. David graduated magna cum laude from the University of Northern Iowa in 1993 with a degree in Accounting, earning national honors with the Elijah Watt Sells Award on the May 1993 CPA exam.

Dave currently serves as President and Chief Financial Officer for Telos Capital, LLC and ExchangeRight Real Estate. He is focused on acquisitions and financial reporting for the Company. Dave began his career with KPMG in the financial services audit practice, where he served both private and public banking and investment management clients. Most recently, Dave was with Kaufman Jacobs Real Estate Investments where he was involved in the investment acquisition, capital markets, and financial reporting aspects of their real estate private equity business. Mr. Van Steenis graduated from Trinity Christian College with highest honors with a B.S. in Accounting and a Finance concentration. Dave is a CPA, a CFA Charterholder, and a member of the CFA Society of Iowa.

Susana serves as the Chief People Officer and Chief Compliance Officer for ExchangeRight, focusing on the development, training, and expansion of the firm’s departments. Susana also serves as a Registered Principal and the Chief Compliance Officer for ExchangeRight Securities, LLC, a FINRA member Broker-Dealer that oversees the wholesale activities of ExchangeRight. Susana began her career in the industry in 2007 with JRW Investments. In 2014, she was primarily responsible for forming the Broker-Dealer, Lighthouse Capital Group, LLC which now oversees JRW Investments. She serves as a Registered Principal and Chief Operating Officer of these firms as well. Susana has been critical to the growth and development of the issuer and other affiliate firms, and ensures the various companies operate in compliance with the regulations instituted by FINRA and the SEC.

Kevin currently serves as Chief Accounting Officer for Telos Capital and ExchangeRight Real Estate, LLC. He is focused on the financial reporting for the Company. Prior to joining ExchangeRight, Kevin enjoyed a successful career in public accounting. He started his career at Gabelmann & Associates in their audit practice. Most recently, Kevin spent seven years with Honkamp Krueger & Co, P.C., a regional CPA firm based out of Dubuque, IA. Mr. Steines oversaw the day-to-day operations of the accounting and tax practice for one of Honkamp Krueger’s satellite offices. His focus was on corporate and individual tax planning and preparation, financial statement preparation, general business consulting, strategic planning, and franchise services. He graduated in 2006 from Ashford University with a B.S. in Business Administration and Accounting with a Finance concentration, where he was awarded Outstanding Accounting Student for his class. Kevin is a CPA.

Tim currently serves as the Director of Asset Management and Senior Controller at ExchangeRight. He joined the company in 2021 as Senior Controller and expanded his role to oversee asset management in 2023. Tim is focused on leading his team to proactively manage ExchangeRight's assets by overseeing tenant relations, strategic leasing initiatives, and stewardship of the physical properties. Tim began his career at PricewaterhouseCoopers in the private company services audit practice, where he served family-owned and private equity-backed organizations in the Minneapolis, MN area. He later spent six years at McCoy Group, where he led the accounting function for the transportation division and contributed to strategic acquisitions and divestitures. Tim holds both B.A. and Master degrees in Accounting from the University of Northern Iowa, graduating in 2013. He also earned national recognition with the prestigious Elijah Watt Sells Award for outstanding performance on the May 2013 CPA exam.
All information is as of 12/31/25 unless otherwise stated. Class S historical returns are hypothetical based on Class I actual returns adjusted for the Class S upfront and ongoing fee structure as no Class S shares had been issued as of 12/31/25. Class D historical returns before August 2025 are hypothetical based on Class I actual returns adjusted for the Class D upfront and ongoing fee structure as no Class D shares had been issued until August 2025. Class A historical returns for April, May, and June of 2019 are hypothetical based on Class I actual returns adjusted for the Class A upfront fee structure as no Class A shares had been issued until July 2019. Past performance of the Sponsor, Tenants, and any past offerings does not guarantee future results.
The information contained on this website represents ExchangeRight’s view of the current market environment as of the date appearing in this material only. Past performance does not guarantee future results. Financial information is approximate and as of the date noted.
Important Disclosure Information
There is no guarantee that Essential Income REIT (the “Essential Income REIT” or “Trust” or “Investment”) will be successful or that the Trustee will be successful in executing the Essential Income REIT’s objectives. In the event of a market downturn, there may be lengthened illiquidity and/or disruption in performance.
This Investment relies upon the decisions of the Trustee. Prior successes by any previous investments or their principals, officers, or managers are not indicative of future performance, nor are they any guarantee of liquidity, of a shorter- or longer-term hold period, against loss, or against an interruption or reduction in income—all of which are risks of real estate and real estate investments, including this Investment. The principals of the Trustee have conflicts of interest that could impact the management of this Investment based on the needs and investment opportunities of other companies. This may lead to a conflict of interest between their various roles, including conflicts with the investors regarding decisions related to the Essential Income REIT and acquisition and management of the Essential Income REIT.
Do not invest solely based on distributions that the Essential Income REIT may be currently generating or targeting to generate. Any distributions will depend upon the successful operation of the properties that the Essential Income REIT acquires. Returns are not guaranteed. While this Investment includes a liquidity feature, there can be no assurance that liquidity will be obtained at any point in the future or that a future liquidity event would be profitable.
The Essential Income REIT plans to utilize leverage, which may magnify the impact of any risks, including fluctuations in interest rates, which may significantly affect the returns of this Investment. Material economic disruption globally or especially in the United States could have a material impact on the value of this Investment and could significantly delay or thwart potential liquidity events. Local development may also impact property values, as is the case with all real estate and real estate investments.
Please note that every real estate investment, including this Investment, is speculative, is illiquid, has the potential for complete loss of principal, and carries downside risks due to variables such as potentially declining market values, re-leasing risk, interest rate risk, refinancing or financing risk, acts of God, and management and/or operational failures.
The photos included are representative of similar corporate-backed stores and may not be the actual locations included in the portfolio. There is no guarantee that all of the identified properties will be acquired.
“Investment-grade” refers to tenants whose long-term corporate debt rating is considered investment grade by Standard & Poor’s, Moody’s, or Fitch. An investment grade rating is a rating that indicates that a corporate bond has a relatively lower risk of default than a corporate bond with a speculative grade.
Potential investors should consult their own tax and legal advisors as ExchangeRight does not provide tax or legal advice and each investor’s tax considerations are different. Any of the data provided herein should not be construed as investment, tax, accounting or legal advice.
Summary of Risk Factors
Our business, financial condition and results of operations are subject to numerous risks and uncertainties. Below is a summary of the principal factors that make an investment in our Common Shares speculative or risky. This summary does not address all of the risks that we face and should be read in conjunction with the full risk factors contained in our Form 10 filed with the Securities and Exchange Commission.
Certain information contained in this material has been obtained from sources outside ExchangeRight, which in certain cases has not been updated through the date hereof. While such information is believed to be reliable for purposes used herein, no representations are made as to the accuracy or completeness thereof and none of ExchangeRight or any of their affiliates takes any responsibility for, and has not independently verified, any such information.
Opinions expressed reflect the current opinions of ExchangeRight as of the date appearing in the materials only and are based on ExchangeRight’s opinions of the market environment, which is subject to change. Investors, representatives, advisors, and prospective investors should not rely solely upon the information presented when making an investment decision and should review the most recent Private Placement Memorandum (“PPM”), as supplemented, available at https://www.exchangeright.com/the-essential-income-reit. Certain information contained in the materials discusses general market activity, industry or sector trends, or other broad-based economic, market or political conditions and should not be construed as research or investment advice.
All rights to the trademarks and/or logos presented herein belong to their respective owners and ExchangeRight’s use hereof does not imply an affiliation with, or endorsement by, the owners of those logos.
Forward-Looking Statements
Certain statements contained in this website other than historical facts may be considered “forward-looking statements,” and, as such, may involve known and unknown risks, uncertainties and other factors which may cause the actual results, performance or achievements of ExchangeRight Essential Income REIT to be materially different from future results, performance or achievements expressed or implied by such forward-looking statements. Forward-looking statements, which are based on certain assumptions and describe the Company’s future plans, strategies and expectations, are generally identifiable by use of the words “may”, “will”, “should”, “estimates”, “projects”, “anticipates”, “believes”, “expects”, “intends”, “future” and words of similar import, or the negative thereof. Forward-looking statements in this registration statement include information about possible or assumed future events, including, among other things, discussion and analysis of our future financial condition, results of operations, our strategic plans and objectives, occupancy, leasing rates and trends, liquidity and ability to meet future obligations, anticipated expenditures of capital and other matters. Readers are cautioned not to place undue reliance on these forward-looking statements.
Any such forward-looking statements are subject to unknown risks, uncertainties and other factors, which in some cases are beyond our control and are based on a number of assumptions involving judgments with respect to, among other things, future economic, competitive and market conditions, all of which are difficult or impossible to predict accurately. To the extent that our assumptions differ from actual results, our ability to meet such forward-looking statements, including our ability to generate positive cash flow from operations, provide distributions to shareholders and maintain the value of our real estate properties, may be significantly hindered.
This website must be read in conjunction with ExchangeRight Essential Income REIT’s Private Placement Memorandum in order to fully understand all the implications and risks of an investment in the ExchangeRight Essential Income REIT. Please refer to the PPM for more information regarding state suitability standards and consult a financial professional for share class availability and appropriateness.
THIS IS NEITHER AN OFFER TO SELL NOR A SOLICITATION OF AN OFFER TO BUY THE SECURITIES DESCRIBED IN THE PPM FOR THE OFFERING, AS AMENDED AND SUPPLEMENTED (THE “PPM”). THE OFFERING IS MADE ONLY BY THE PPM AND THIS MATERIAL MUST BE PRECEDED OR ACCOMPANIED BY THE PPM. NEITHER THE SECURITIES AND EXCHANGE COMMISSION NOR ANY OTHER STATE SECURITIES REGULATOR HAS APPROVED OR DISAPPROVED OF THE SECURITIES OR DETERMINED IF THE PPM IS TRUTHFUL OR COMPLETE. ANY REPRESENTATION TO THE CONTRARY IS UNLAWFUL.